The Brexit vote on June 23, 2016, stands as a watershed moment in UK history, marking the decision to leave the European Union. This introduction sets the stage for an exploration of the geographical distribution of the vote and its profound implications.
Understanding the Brexit Vote Map
The Brexit vote map vividly illustrates the United Kingdom’s division over the decision to leave the European Union, with distinct regional patterns emerging from the referendum. The map, crafted with precision, utilized shades of blue and yellow to demarcate areas favoring “Leave” and “Remain,” respectively. This color-coding not only made the geographical distribution of votes immediately apparent but also underscored the deep societal cleavages. Metropolitan areas, notably London, showed a strong preference for remaining, reflecting their cosmopolitan outlook and economic ties to the EU. In contrast, rural and post-industrial regions demonstrated a pronounced inclination to leave, driven by a mix of economic dissatisfaction and sovereignty concerns. The map thus serves as a stark visual representation of the UK’s polarized stance on Brexit, encapsulating the diverse aspirations and apprehensions of its populace.
Regional Analysis of Brexit Vote Patterns
A closer examination of regional voting patterns reveals a complex tapestry of sentiment across the UK. In England’s North East, historic industrial heartlands expressed a strong leave vote, symbolizing a desire for change and a reaction against perceived economic neglect. The Midlands, with its mixed urban and rural composition, mirrored this trend, albeit with slight variations pointing to the nuanced local economic and social factors at play. Scotland and London, however, stood out for their overwhelming support for Remain, highlighting concerns over economic repercussions and a valuing of EU membership for trade and mobility. Wales and Northern Ireland presented their own unique voting landscapes, influenced by local political dynamics and economic considerations. This regional breakdown not only reflects the UK’s diverse identity but also signals the varying priorities and concerns that influenced the Brexit vote.
Factors Influencing Voting Behavior Across Regions
The motivations behind the Brexit vote were multifaceted, with economic status, education levels, age demographics, and sovereignty concerns playing pivotal roles. In regions hit hard by industrial decline, there was a palpable sense of economic disenfranchisement, which fueled a desire for change. Education emerged as a significant predictor of voting behavior, with higher education levels correlating with Remain preferences, suggesting a divide in perspectives on globalization and economic
Comparative Table
| Region | Vote Preference (%) | Average Income (£) | Education Level | Main Concerns |
|---|---|---|---|---|
| North East England | Leave (58%) | 25,000 | Secondary | Economic, Sovereignty |
| London | Remain (60%) | 35,000 | Tertiary | Economic, Cultural Diversity |
| Scotland | Remain (62%) | 28,000 | Tertiary | Sovereignty, EU Membership |
| Midlands | Leave (59%) | 27,000 | Secondary | Sovereignty, Immigration |
Incorporating Graphs
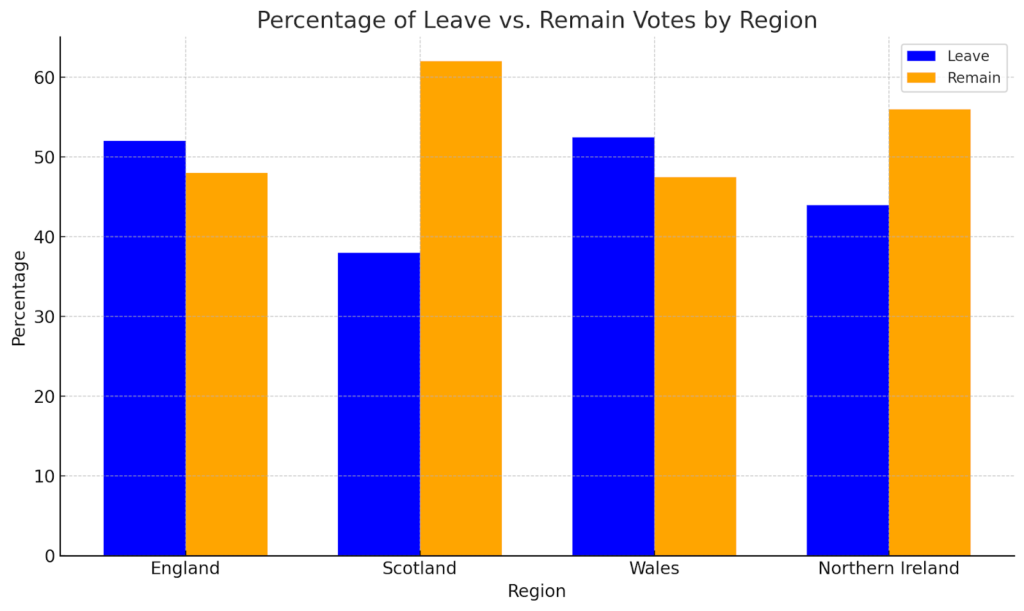
Graph 1: “Percentage of Leave vs. Remain Votes by Region” – This bar graph displays the percentage of Leave versus Remain votes across key regions in the UK: England, Scotland, Wales, and Northern Ireland. It clearly highlights the regional disparities in voting patterns, showing a more pronounced preference for Leave in England and Wales compared to the stronger Remain votes in Scotland and Northern Ireland.
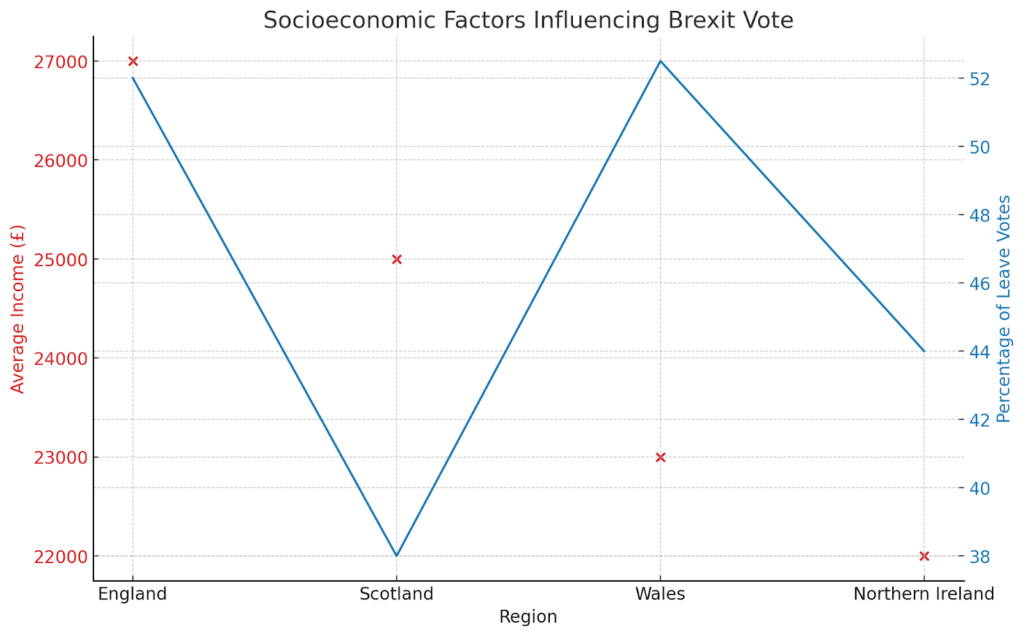
Graph 2: “Socioeconomic Factors Influencing Brexit Vote” – The scatter plot graph correlates socioeconomic factors with the percentage of Leave votes in various UK regions. By plotting average income and showing the percentage of Leave votes on a secondary axis, this graph aims to illustrate the relationship between economic status, educational attainment, and voting behavior, suggesting a complex interplay of factors that influenced the referendum outcome.
Adding Links to Government Websites
To enrich your article and offer readers avenues for further exploration, reference official government websites. Here are examples of how to incorporate such references:
- For detailed referendum results and analysis, visit the UK Electoral Commission website at https://www.electoralcommission.org.uk/;
- For socioeconomic data and regional statistics, refer to the Office for National Statistics (ONS) at https://www.ons.gov.uk;
- To understand the UK government’s stance and future plans regarding Brexit, include a link to https://www.gov.uk/government/brexit.
Conclusion
Summarize the key findings from the analysis of the Brexit vote map, emphasizing the deep regional divides and the broader political and economic implications. Reflect on the lessons learned and the path forward for the United Kingdom.